Apiome Dashboard
The single pane of glass for your entire Apiome platform — KPIs, governance, and portfolio health in one operator surface.
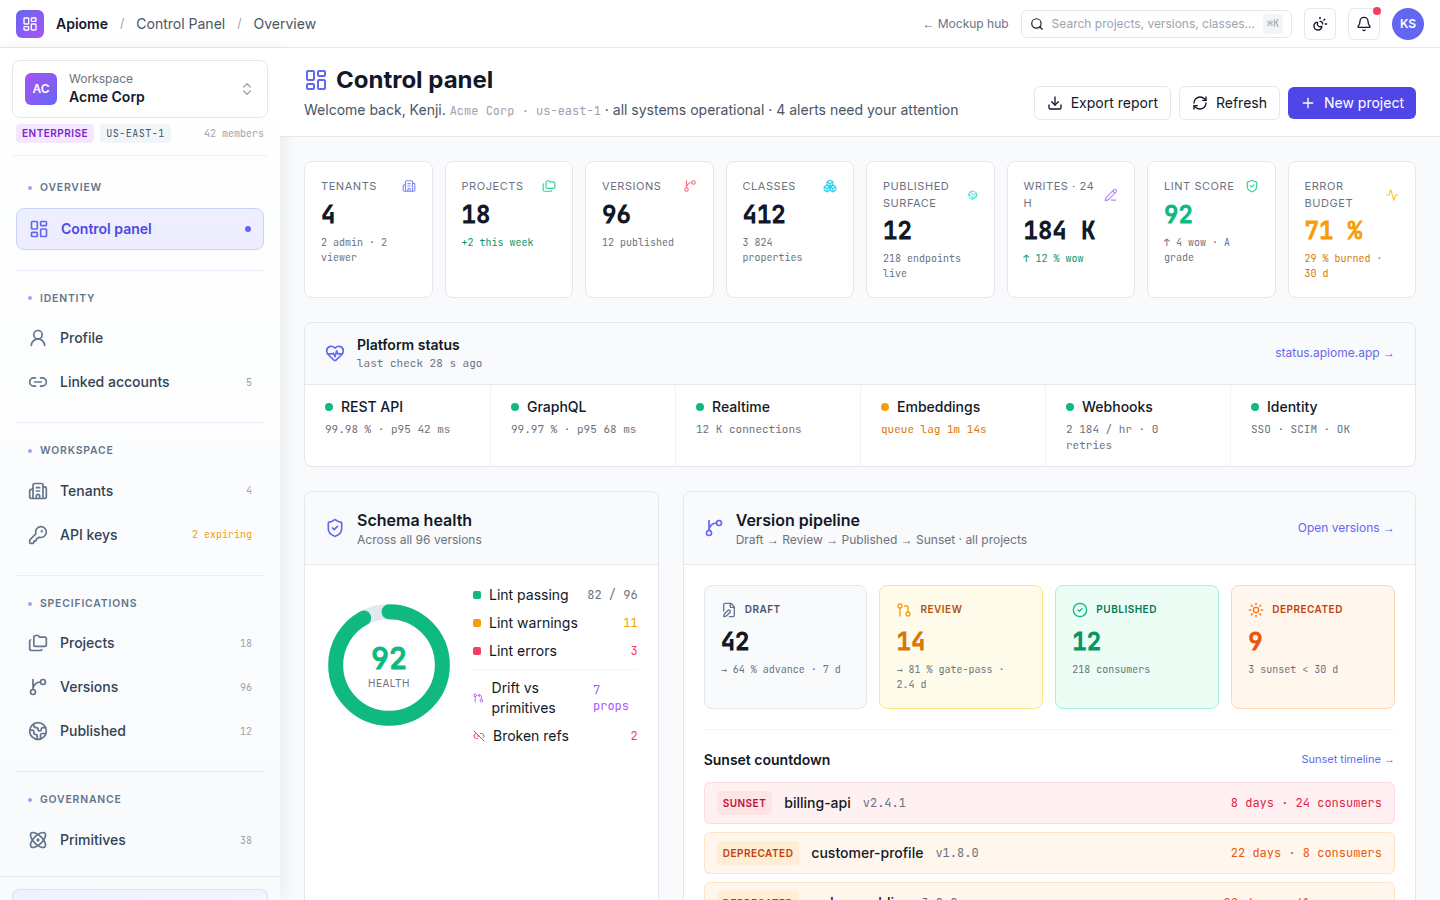
Apiome Dashboard is the enterprise control panel that replaces the old five-card stat grid with a full operator-and-owner surface. Watch platform KPIs, schema health, and the draft-to-published version pipeline at a glance, then drill into tenants, API keys, and primitive governance without ever leaving the page.
What ships with Dashboard
Every Dashboard surface is wired into the rest of the Apiome platform — no glue code, no separate identity, no bolt-on integrations.
KPI command band
An at-a-glance band tracking tenants, projects, versions, published surface area, lint score, and error budget.
Schema health & version pipeline
A schema-health donut beside a draft → review → published funnel with per-step counts and transition rates.
Multi-tenant management
Tenant cards with plan and seat counts, residency, members preview, audit pulse, and billing health.
API key lifecycle
Scoped keys with rotation timers, IP allowlists, usage sparklines, and a guarded revoke flow.
Primitive governance
A primitive registry that maps usage across versions and flags drift and deprecation candidates.
Action-needed & audit trail
A guided quick-acts checklist — configure SSO, issue a key, set retention — alongside a live audit and activity feed.
A look inside Apiome Dashboard
Live design previews from the Dashboard mockup pack — 9 surfaces in total.
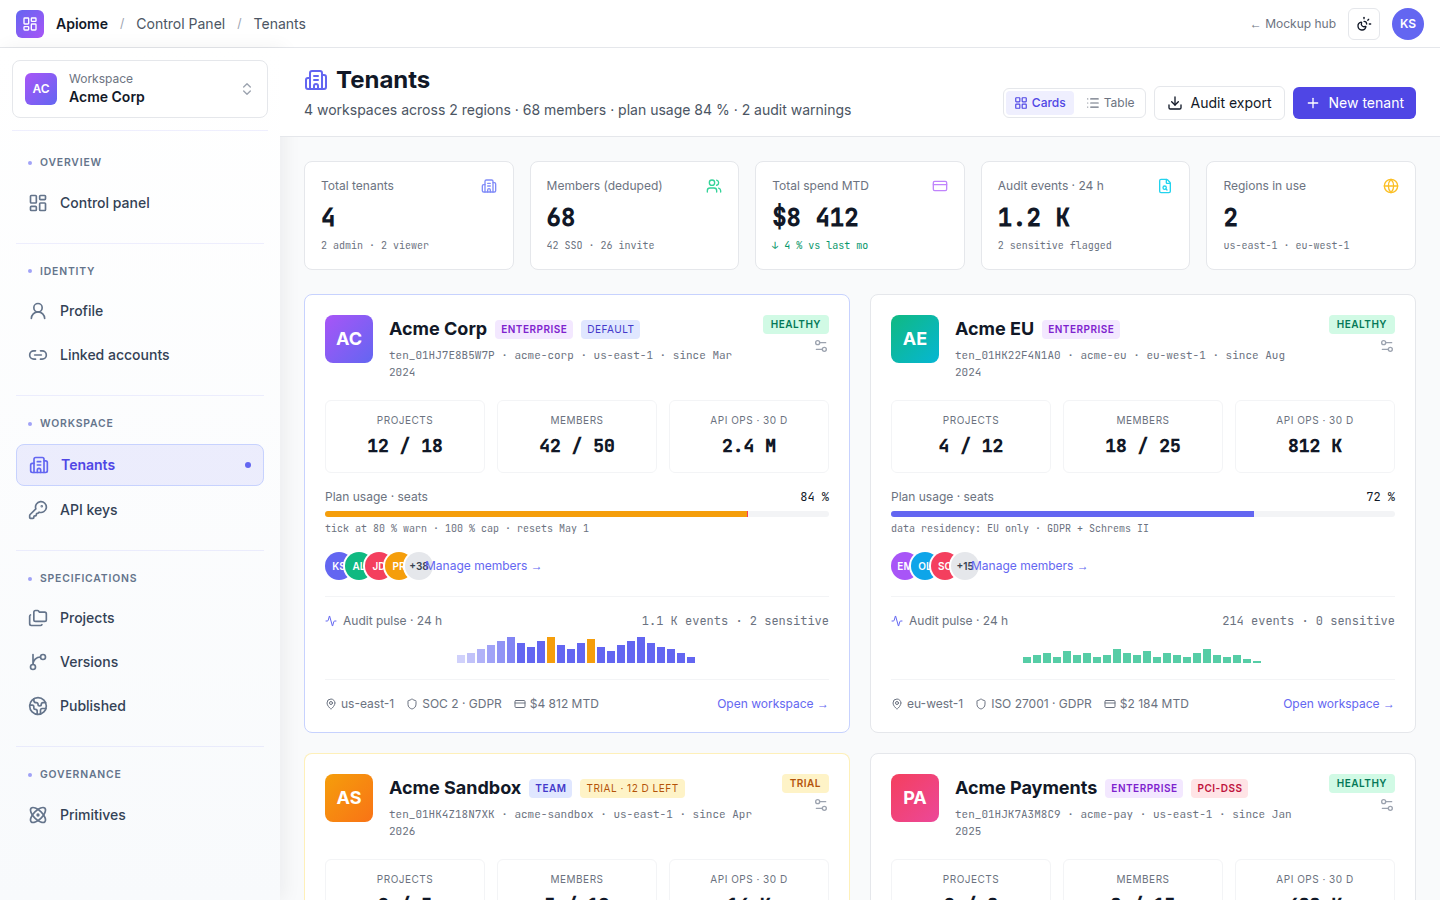
Tenant cards showing plan, seats, data residency, members, and a live 24-hour audit pulse.
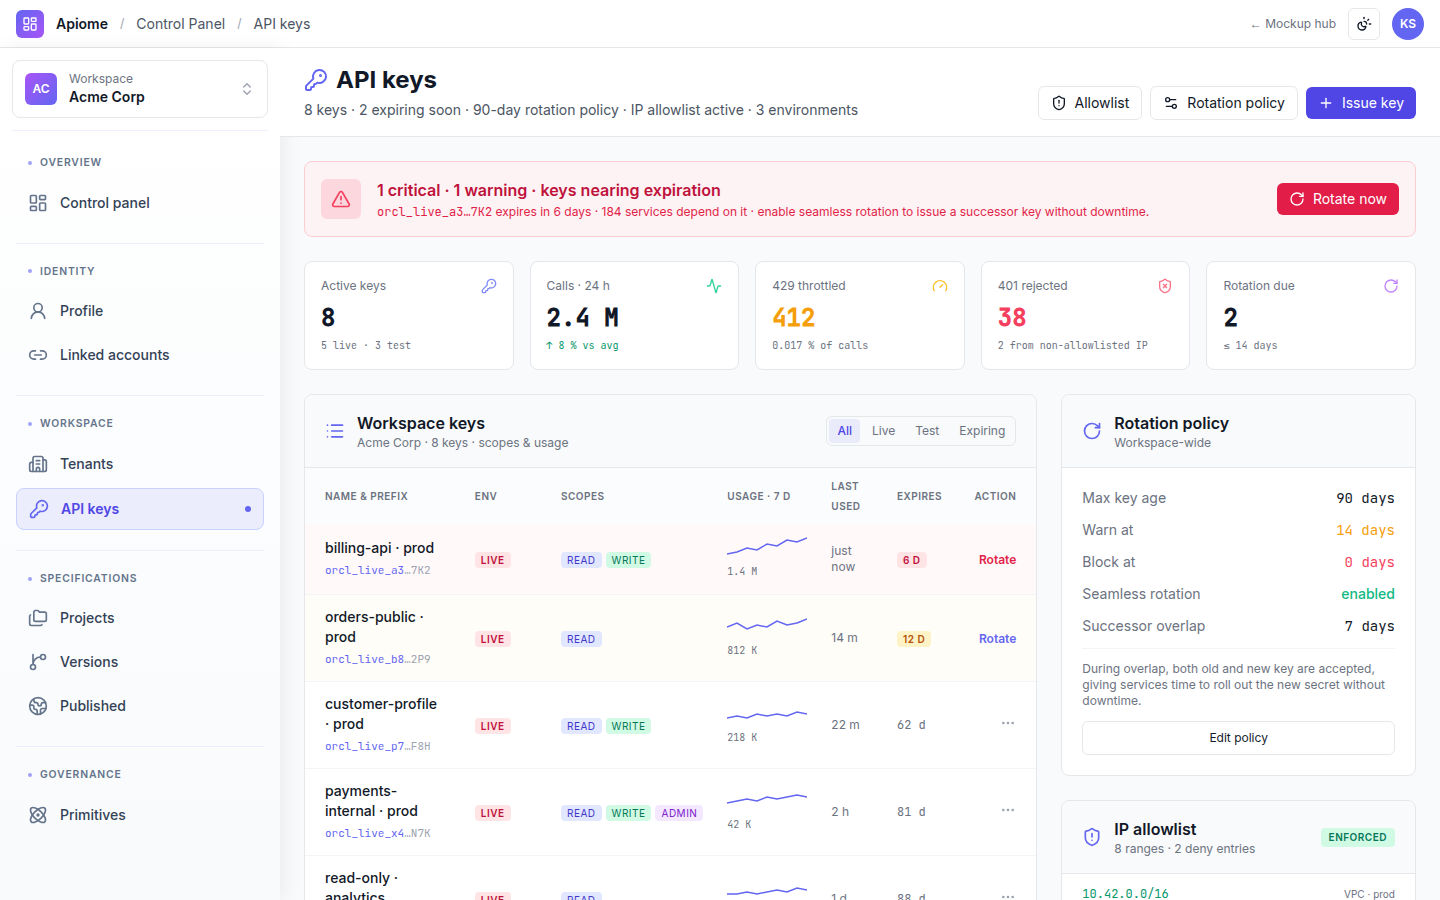
Keys table with scopes, rotation timers, IP allowlists, usage sparklines, and one-click revoke.
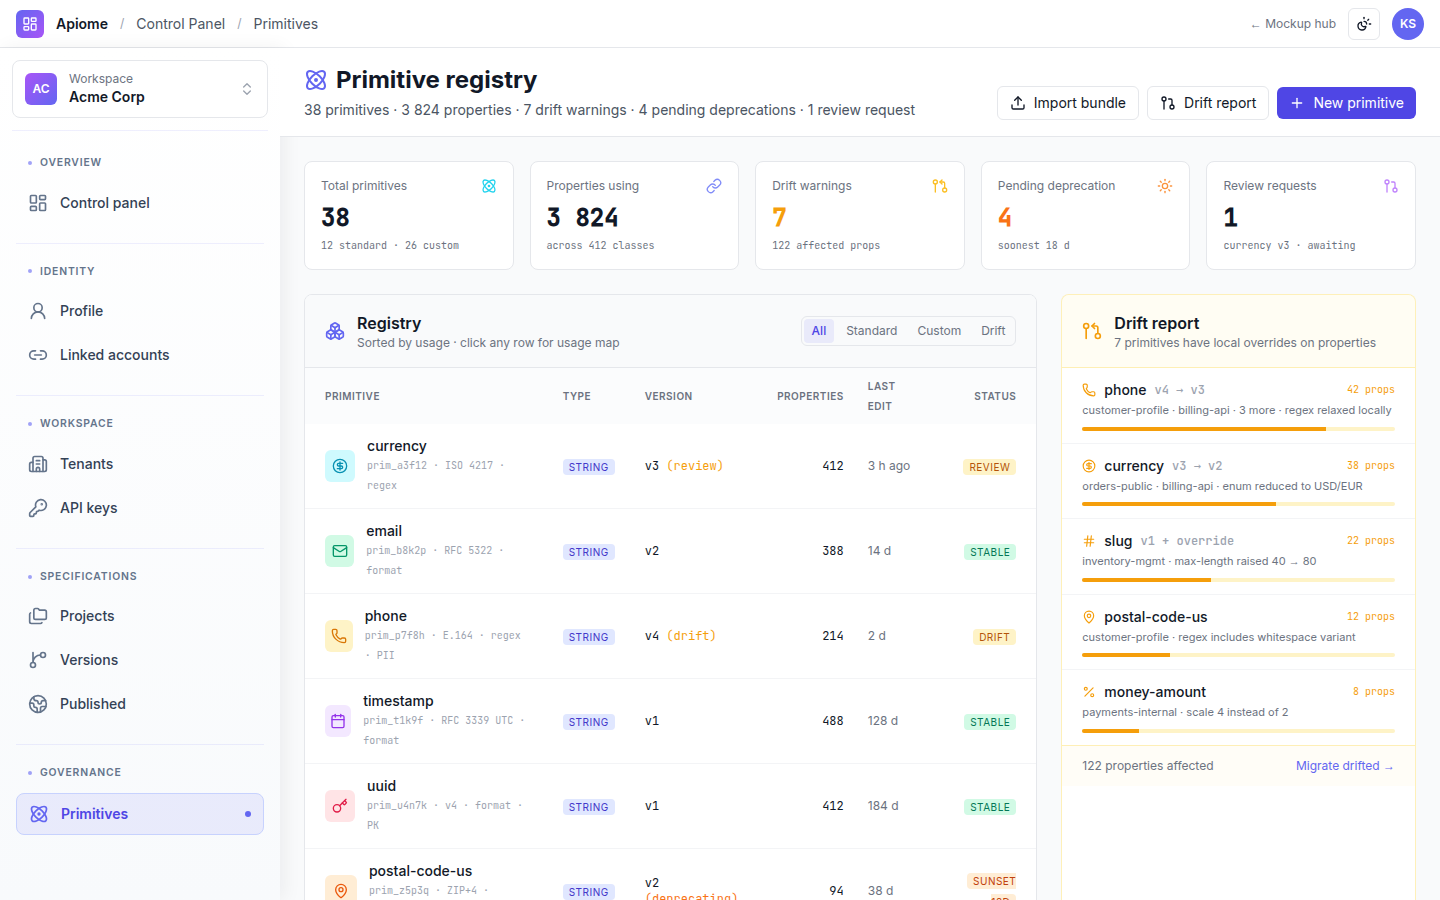
Primitive registry with a cross-version usage map, drift report, and deprecation queue.
Use cases
Dashboard is designed around the way real teams actually work — not the way a tool wants them to work.
Watch error budget, lint health, and published surface area across the whole tenant from one screen.
Rotate keys, enforce IP allowlists, and review the audit pulse for sensitivity spikes.
Triage the portfolio by quality score and unblock stuck versions in the pipeline.
- SSO / SCIM provisioning with active-session and recovery-code management
- Per-tenant data-residency controls across US, EU, and APAC
- IP allowlists and scoped, auto-rotating API keys
- Immutable audit trail with sensitivity-flagged event spikes
- Quota and error-budget governance with threshold alerts
- Summarize platform health into a daily operator briefing
- Explain the root cause behind a lint-score or error-budget dip
- Recommend which primitives to deprecate from the drift report
- Draft the SSO and key-rotation steps in your action-needed queue
AI operations copilot
Dashboard's AI copilot watches your platform signals and surfaces what needs attention — drift, deprecations, quota risk — before they page you.
Every DashboardAI feature is grounded in your tenant's data, runs under your data-residency policy, and respects every role and ACL the platform enforces.
Every surface in Apiome Dashboard
A look at the 9 screens designed for this suite — covering everything from day-1 onboarding to day-100 operations.