Apiome Monitoring
See every request. Catch every incident. Prove every SLA.
A full-stack observability layer for the Apiome platform that unifies API performance metrics, immutable audit trails, centralized logging, alerting, incident management, and SLO tracking — so operations teams detect, diagnose, and resolve issues before customers notice.
What ships with Monitoring
Every Monitoring surface is wired into the rest of the Apiome platform — no glue code, no separate identity, no bolt-on integrations.
API performance metrics
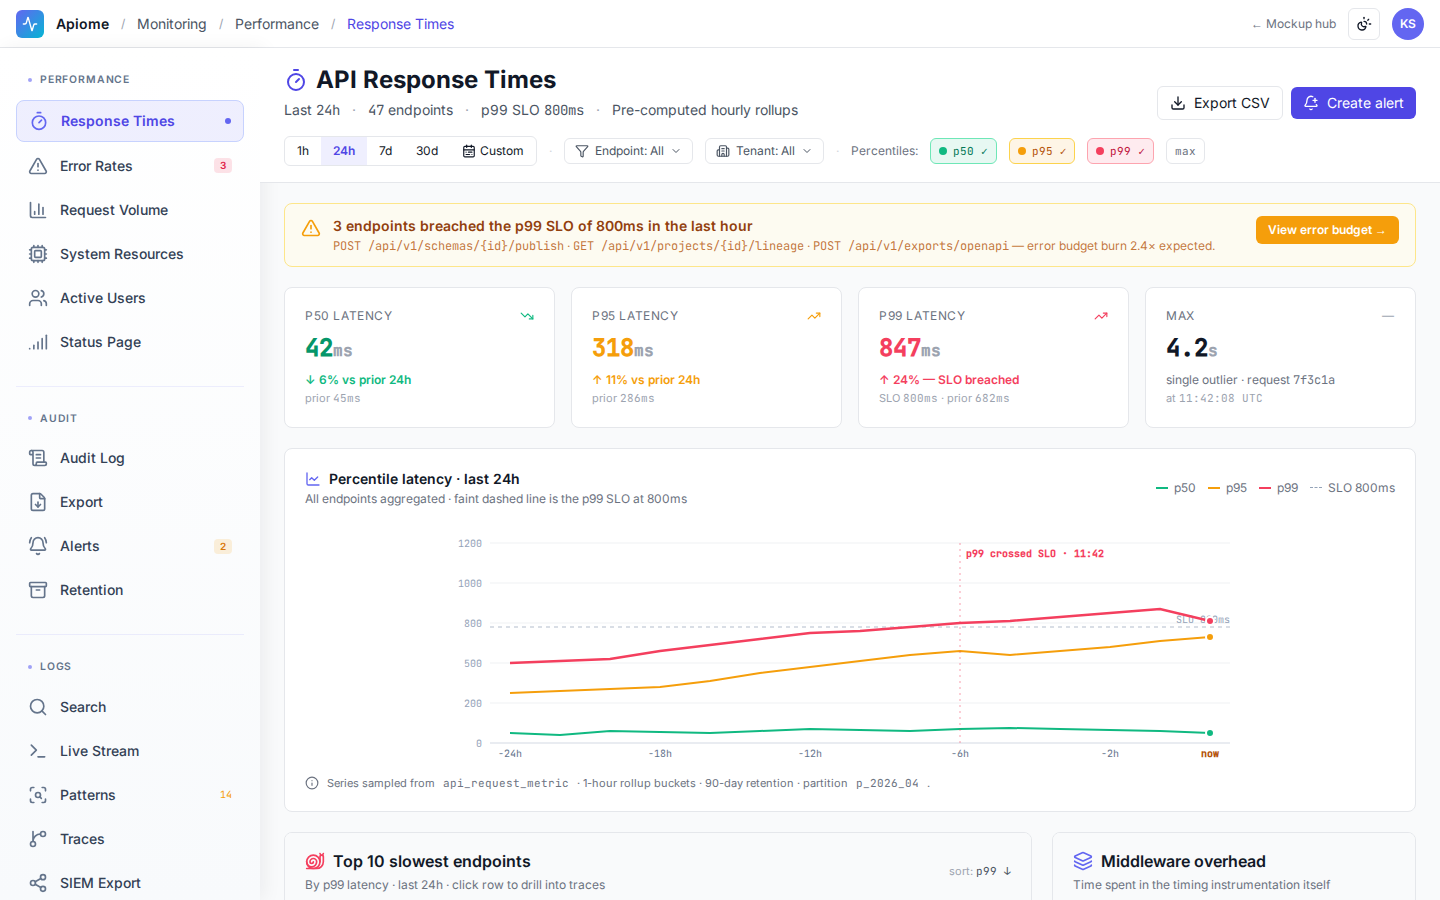
Track p50/p95/p99 response times, error rates, and request volume per endpoint and tenant, backed by pre-computed rollups.
Immutable audit trail
Every security-relevant action captured in an append-only log enforced at the database level, exportable for compliance.
Centralized log management
Structured logs with full-text search, real-time streaming, trace correlation, and automatic PII redaction.
Custom alert rule engine
Threshold, anomaly, composite, and heartbeat rules evaluated at one-minute resolution, delivered to email, Slack, PagerDuty, and webhooks.
Incident management
Promote alerts to incidents with ownership and a complete event timeline; close the loop with post-mortems and MTTA/MTTR metrics.
SLO & error budget tracking
Define availability and latency SLOs per service, watch error budgets burn in real time, and generate customer-facing SLA reports.
A look inside Apiome Monitoring
Live design previews from the Monitoring mockup pack — 24 surfaces in total.
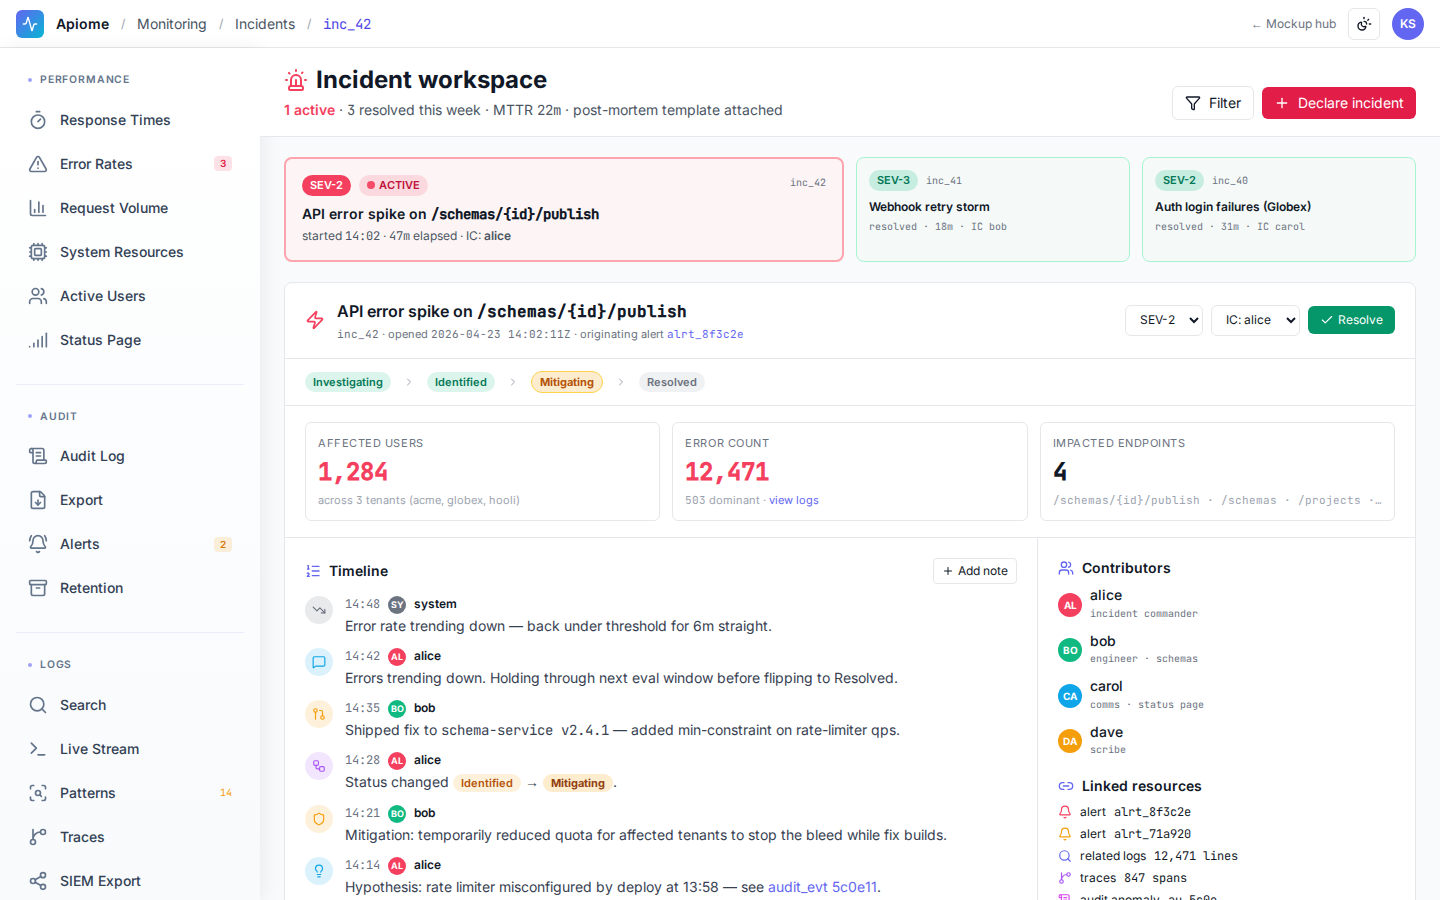
Incident management in action: an error spike promoted to an incident with ownership, a full event timeline, and root-cause notes feeding the post-mortem.
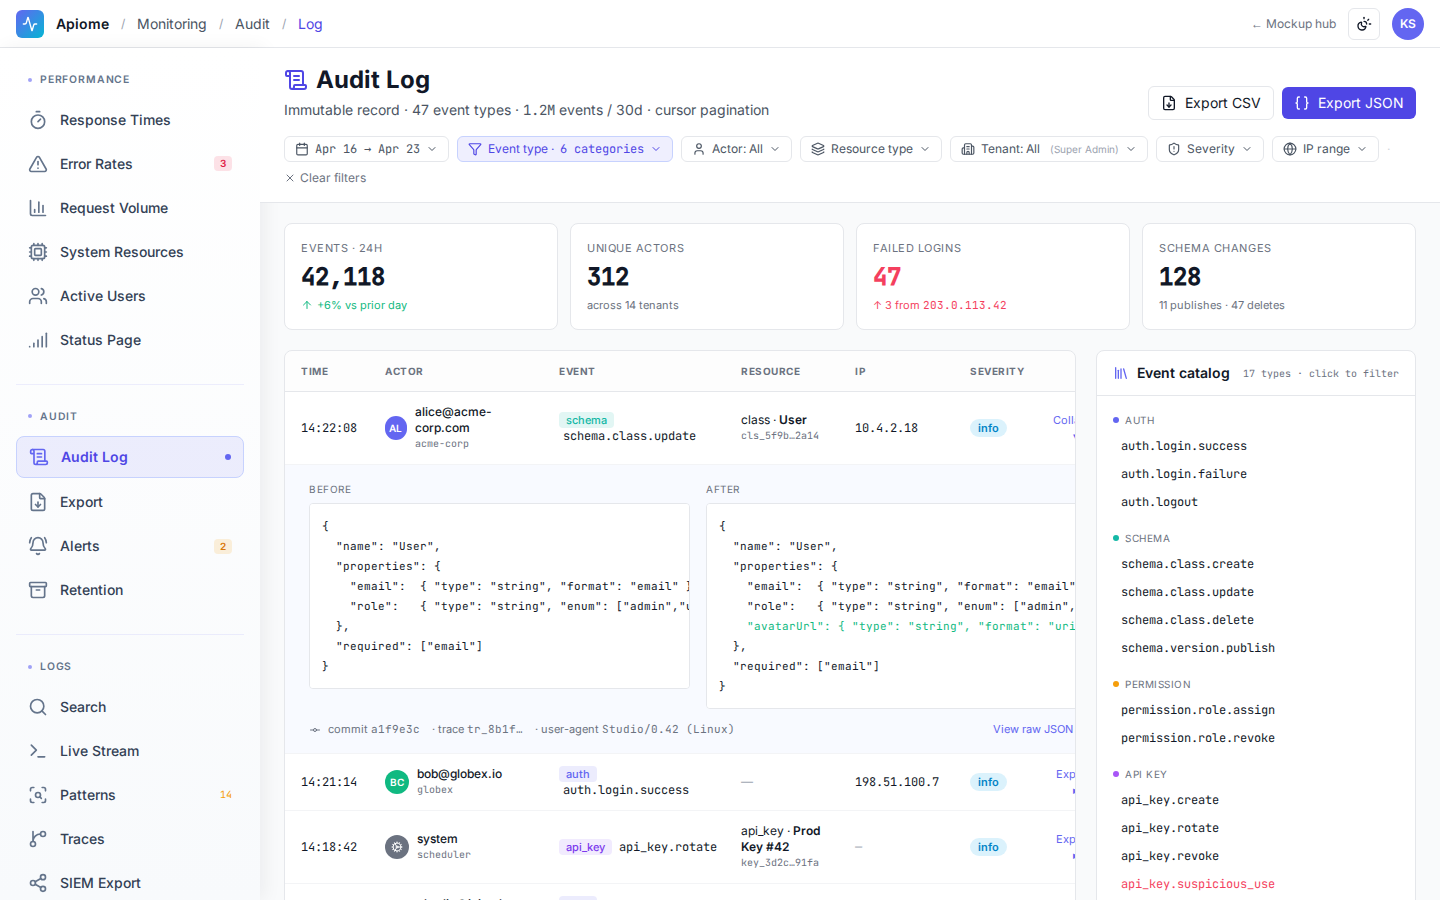
The audit log viewer — an immutable record spanning 47 event types, filterable by actor and date, with one-click CSV or JSON compliance export.
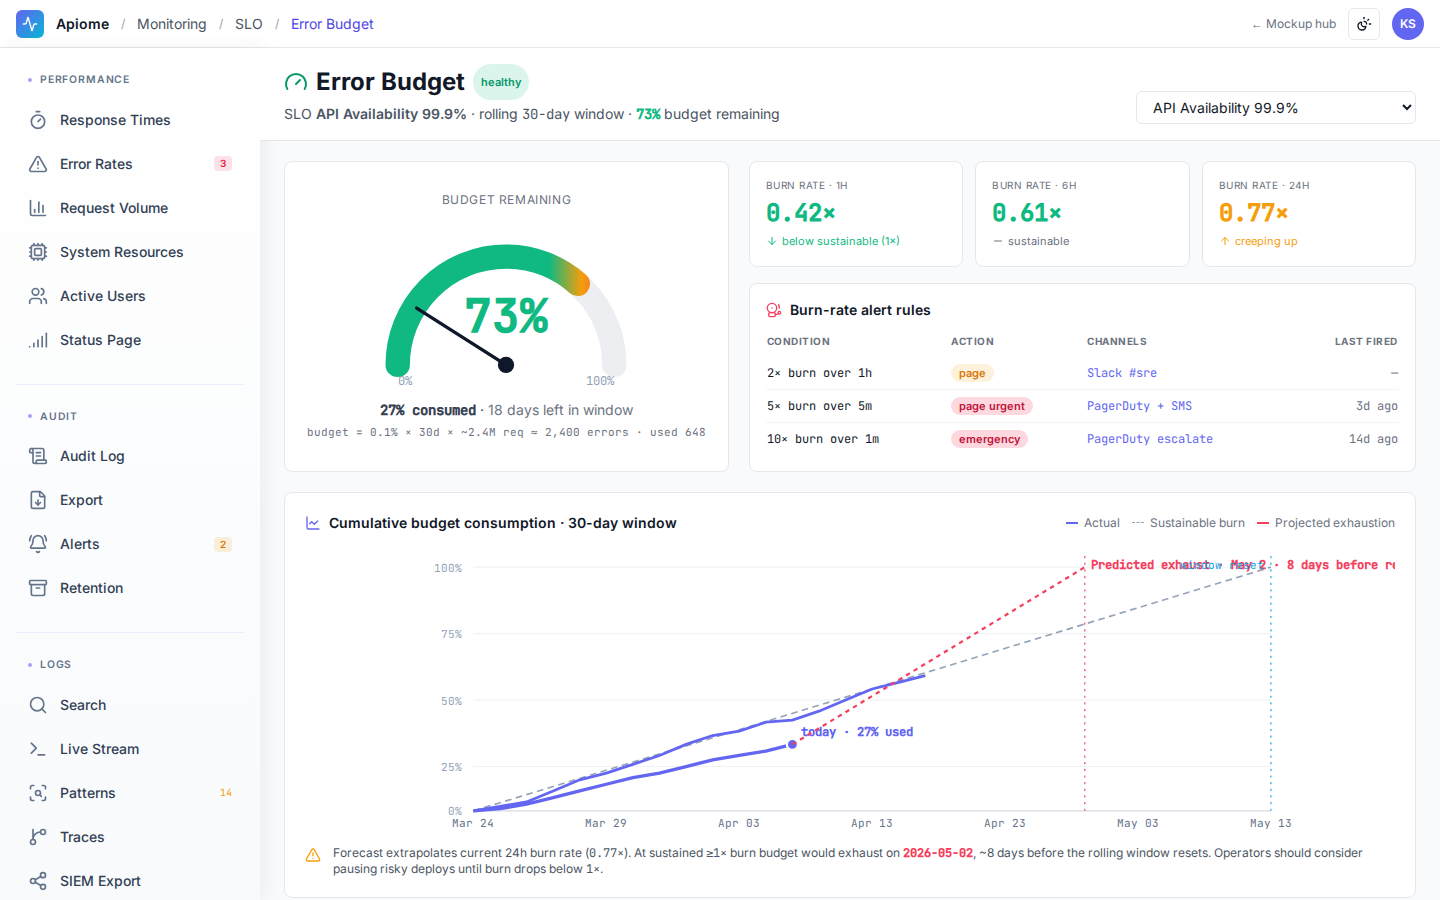
Error budget tracking against defined SLOs: remaining budget at a glance, burn rate by hour and day, and predicted exhaustion.
Use cases
Monitoring is designed around the way real teams actually work — not the way a tool wants them to work.
An anomaly alert pages on-call through PagerDuty; the team drills from the alert into correlated logs and traces and tracks resolution on a shared timeline.
Filter the immutable log to every permission change and key event in the review period and export the set as CSV — retention and SIEM forwarding already covered.
Set a 99.9% availability SLO per service, review error-budget burn before risky releases, and hand customers monthly SLA reports.
- SIEM export via webhook or S3 push to Splunk, Datadog, and other platforms
- Monthly customer-facing SLA reports with breach tracking and root-cause links
- Database-enforced immutable audit log with per-tenant retention and cold-storage archival
- PagerDuty and OpsGenie integrations with on-call routing and escalation policies
- Automatic redaction of PII patterns from all log output
- Anomaly detection that baselines every metric and alerts on significant deviations — no hand-tuned thresholds
- Error pattern detection that groups repeated log errors into a single actionable alert
- Error budget exhaustion prediction that forecasts when an SLO will be breached at current burn rate
- Real-time flagging of suspicious API key usage in the audit stream
Signal, not noise
Apiome Monitoring applies statistical modeling to your metrics and logs so anomalies surface themselves — cutting through alert fatigue and telling you what will break before it does.
Every MonitoringAI feature is grounded in your tenant's data, runs under your data-residency policy, and respects every role and ACL the platform enforces.
Every surface in Apiome Monitoring
A look at the 24 screens designed for this suite — covering everything from day-1 onboarding to day-100 operations.